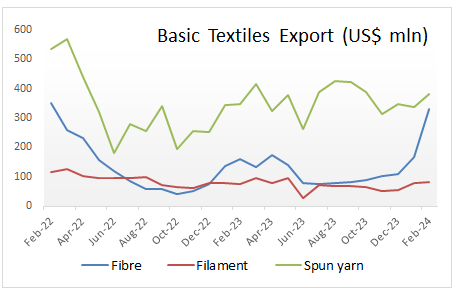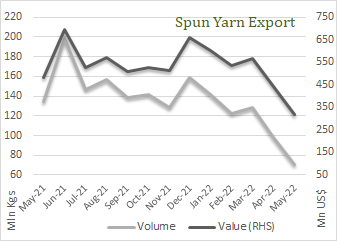
Spun Yarn Export Rises in August, but from a low base
Spun yarn shipment reversed the falling trend in August, largely due pent up volume of June and July and a low base of previous year. Yarn export were hovering above 100 million kgs until June 2016 and thereafter it trickled down below 90 million kgs apart from more than 125 million kgs reported in December 2016 and January 2017.
Exports aggregated 95 million kgs in August 2017, up 17 per cent year on year and 22 per cent in value at US$304 mil-lion. Unit value realization averaged US$3.21 per kg, up US cents 9 from previous month and US cents 14 up compared to August 2016.
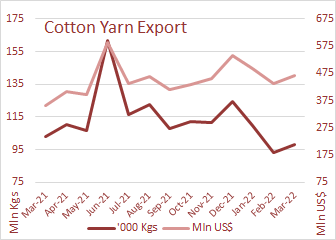
Cotton yarn was exported to 80 markets worth US$240 million (INR1,535 crore) and volumes at 73 million kg. The aver-age unit price realization was at US$3.31 a kg, US cents 8 more than previous month and US cents 16 up from the same month a year ago. China remained the largest importer of cotton yarn from India in August, followed by Bangladesh and Portugal. 10 coun-tries did not import any cotton yarn from India this August as they did last year. However, they were replaced by 18 countries which imported yarn worth US$1.90 million.
Chile, Czech Republic and Turkey were among the fastest growing markets for cotton yarn, and accounted for 4 per cent of total value of cotton yarn exported in August
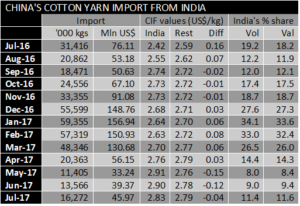
China has been importing lesser yarn from India since April this year. As per Chinese official trade statistics the monthly volumes averaged around 15 million kgs between April and July 2017 as against 55 million kgs between December 2016 and March 2017. The fall can be attributed to two factors – increased domestic production and costlier imports from In-dia. During the last four months, the CIF values averaged US$2.78 a kg, which was about US cents 10 above the average price of imports from rest of the world. The same was US cents 5 less between December and March. The following ta-ble deciphers the trend.
100% man-made fibre yarns export was at 7.3 million kg in August, comprising 4.4 million kg of polyester yarn, 2.7 mil-lion kg of viscose yarn and 0.2 million kg of acrylic yarn. Polyester yarn exports jumped 50 per cent in value while vis-cose yarn exports value plunged 23 per cent during the month. Acrylic yarn exports were down 69 per cent in August.
Polyester spun yarns were exported to 45 countries in August with average unit price realization at US$2.37 a kg. Turkey was the largest importer of polyester yarn, followed by Brazil and Egypt.
Viscose yarn worth US$8.4 million or INR53 crore was exported in August, implying average unit price realization of US$3.15 per kg. Belgium was the top importer worth US$1.75 million, followed by Iran with imports worth US$1.3 million.
Blended spun yarns worth US$42 million were exported in August, up 20 per cent YoY in both volumes and value terms. During the month, 7.9 million kg of PC yarns was exported worth US$20 million. Another 4.7 million kg of PV yarns were exported valued at US$13 million. Turkey and Brazil were the largest importers of PC yarn from India in August followed by Bangladesh while, Turkey was the largest importer of PV yarns from India followed by Pakistan.